Pedestrian Count for Crosswalk Violations

Hi, I am Pratool Bharti, an assistant professor in Computer Science department at Northern Illinois University (NIU). Before joining NIU, I worked for 2 years in a Florida based startup as a research and development manager. There, my role was to design and build computer vision and machine learning based yard management system that automatically tracks the vehicles inside a freight yard. At NIU, I am deeply interested in solving complex real-life problems by employing computer science tools and techniques, especially artificial intelligence and computer vision. While working at Argonne National Lab in summer 2020, I worked on to design and build an AI-enabled computer vision system that counts the pedestrians who violate the crosswalk while crossing the street. The goal of this project is 3-fold; first – detect every pedestrian in the image, second – re-identify the pedestrian in successive frames to avoid their recounting, third – count the pedestrians who do not follow the crosswalk. A sample output image from the project is shown in Figure 1.
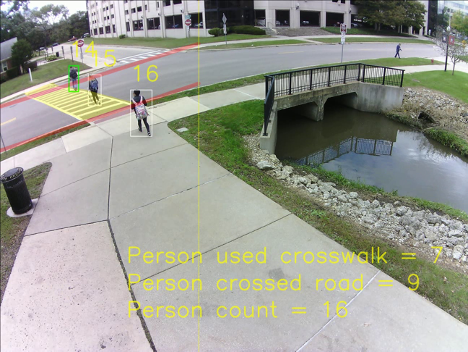
Figure 1: A sample output image of pedestrian count project. Green box represents that the pedestrian has taken the crosswalk while crossing the street. White box represents that the pedestrian has not crossed the street yet. Motivation
An accurate and clear information about pedestrian travel patterns is a critical component of transportation planning, management and safety. Sound data on pedestrian system usage is needed for traffic safety, operations, maintenance as well as system user outreach and education. According to CDC report [1], in 2017 alone, 5977 pedestrians were killed in traffic crashes in the United States. That’s about one death every 88 minutes. The broad motivation of this study is to explore the pedestrian travel patterns to understand the contexts in which they violate the traffic rules. To do so, the immediate goal is to count the number of pedestrians who do not follow the crosswalk while crossing the street.
Data Description
In this study, a total of 2,580,468 images were collected by employing a vision camera embedded in an AoT (Array of Things) [2] node (shown in Fig. 2). The AoT node is installed on a streetlight pole at Northern Illinois University, DeKalb, IL in front of the Computer Science building. The camera captures the image (as shown in Figure 2) at 1 Hz frequency with the resolution of 96 dpi.
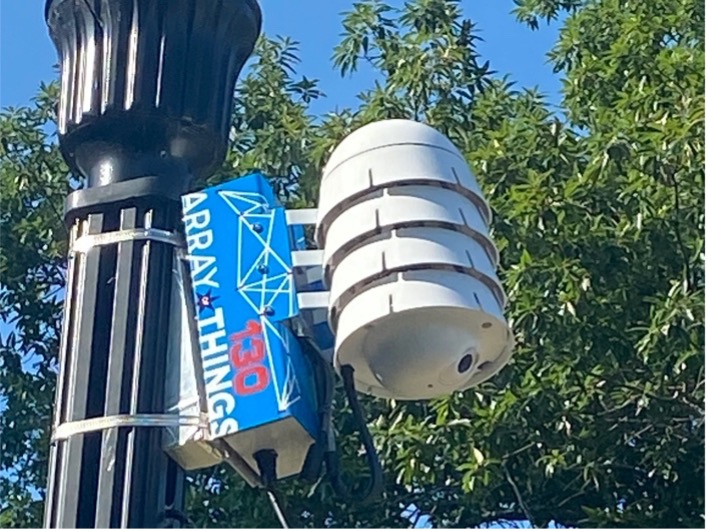
Figure 2: AoT node installed on a light pole at NIU campus Approach
In this section, I present a brief overview of the pedestrians counting process for crosswalk violation. The complete process is divided into 3 sequential sections as shown in Figure 3. First – detect every pedestrian in the image, second – re-identify same pedestrian in successive images to avoid their recounting and third – detect when the pedestrian finished crossing the street. Each part is explained in the following sections.
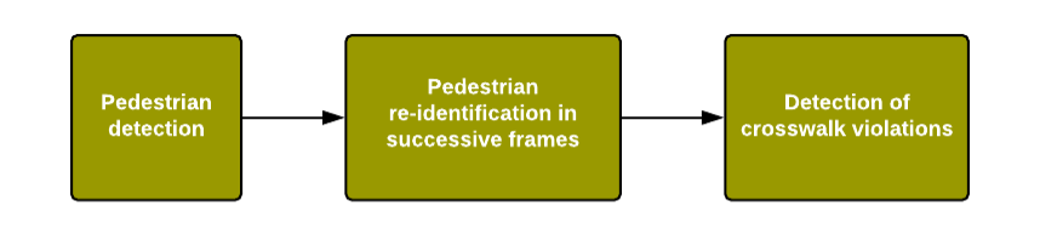
Figure 3: Workflow diagram for pedestrian crosswalk violation Pedestrian Detection
The first step is to detect every pedestrian along with their position in the image. To do so, one approach could be to train a neural network-based pedestrian detection model that identifies and locates the pedestrian in the image. However, this process would require a lot of manual image tagging without getting any new results since several popular pre-trained models are already available that can do a fine job in person detection. These pre-trained models are trained on a popular COCO dataset [3] which includes more than hundred thousand images. Model accuracy is an important factor here because if it misses any pedestrian in the image then the final pedestrian counting cannot be accurate. To take it into consideration, I selected the Faster R-CNN [4] based NasNet [5] object detection model from the TensorFlow model zoo [9]. Although NasNet model has high latency, it has very good mean average precision value to detect the objects precisely in the image. The images are input to NasNet model and store the prediction results in the XML format. A sample of image and generated XML is shown in Figure 4. XML stores each detected objects’ name and their box coordinates.
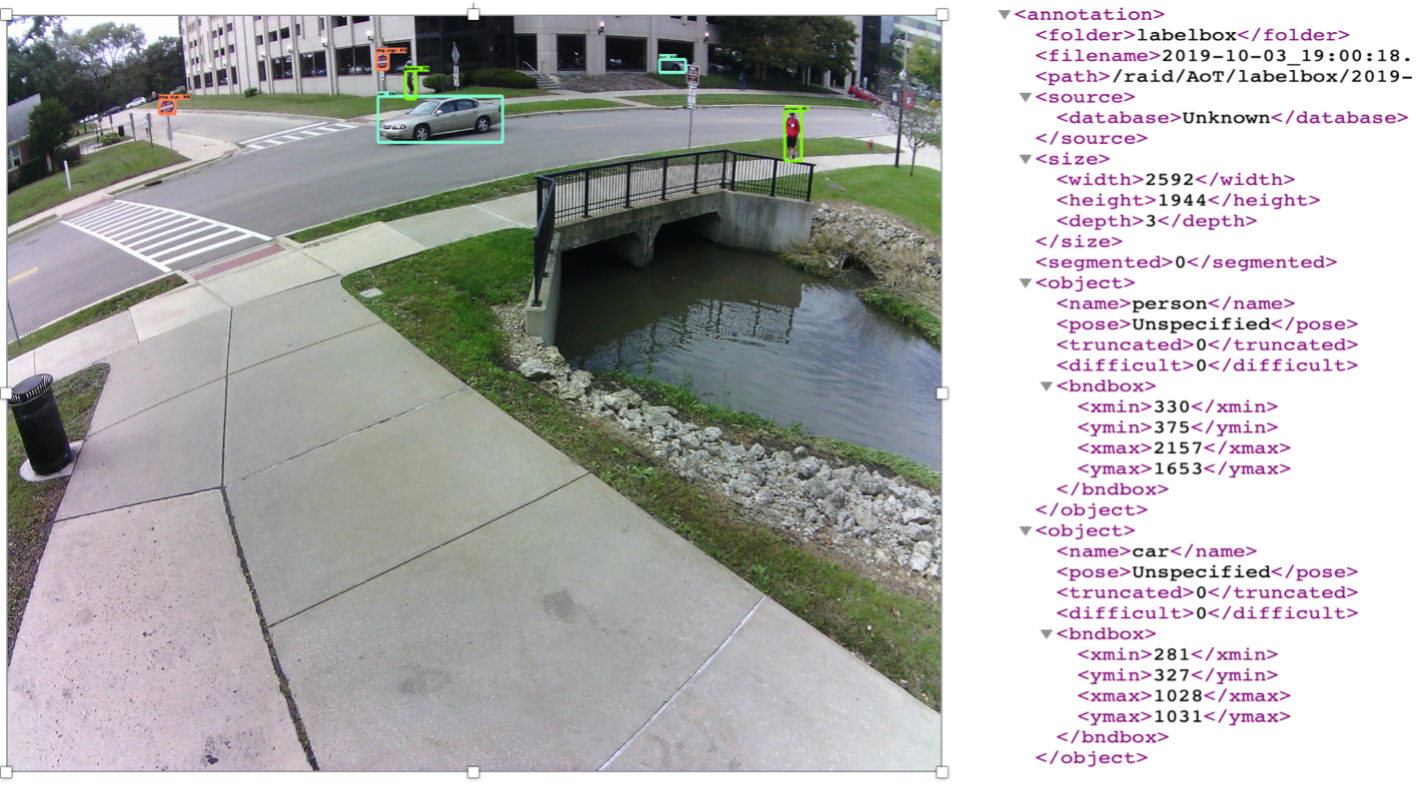
Figure 4: Output image and XML generated from NasNet object detection model. Detected objects are boxed in the image. Pedestrian Re-identification (ReID)
Once each pedestrian’s position is stored in the XML, the next part is to identify them in successive images to avoid their recounting. In computer vision community, this task is called pedestrian re-identification (ReID) [7]. The idea behind ReID is to find a metrics or representation of a pedestrian in the image that is invariant of different angles, distance, zoom level, etc. Neural networks-based models try to learn local regions (shoes, glasses, hair color, etc.) as well as global full body region (t-shirt and shorts color, design, etc.) features to discriminate the one pedestrian from others. At the end of training, these models aim to generate invariant multi-dimensional features of a pedestrian from different angles, distance, clothes, etc. In this study, I have leveraged a deep learning-based model deep-person-reid [7,8] to generate such features of each pedestrian detected in the frame to compare with the pedestrians from the following frames for re-identification. The model generates 1024-dimensional features for each pedestrian cropped in a rectangular box. The cosine similarity is calculated for feature vectors of one frame against successive frames. Pedestrians are considered same if they have high cosine score, hence, assigned the same pedestrian id. In other cases where cosine similarity is below a pre-defined threshold, both pedestrians are assigned different ids. Low matching score may also happen where pedestrian is partially occluded by a car or another pedestrian in next frame, the similarity score gets very low. To mitigate this issue, the algorithm compared the current frame against last 5 consecutive frames to avoid assigning new id to same pedestrian. Another challenge I faced with the threshold-based matching is when one pedestrian had high similarity scores against multiple pedestrians. To fix this issue, I employed the greedy method in which it ranks each pair according to their similarity score. Based on their ranking, the algorithm picks the top pair and assigns same id to both pedestrians, and subsequently removes other pairs where any one of the pedestrians from the top pair is present. By employing these techniques, I was able to assign unique id to distinct pedestrian.
Pedestrian Count for Crosswalk Violation
Now that a unique id is assigned to each distinct pedestrian (barring any errors), the next and the final step in the pipeline is to count the number of pedestrians who have violated the crosswalk while crossing the street. The output of this step will be two metrics for any given time period – 1) number of pedestrians crossed the street and 2) number of pedestrians followed the crosswalk while crossing the street. Subtracting the 2nd metric from 1st one will give the count of crosswalk violations. To compute these metrices, it is important to locate the street and crosswalk in the image. Fortunately, in this case, camera is installed on a fixed streetlight pole which didn’t shake or vibrate significantly due to wind or heavy vehicles. Taking advantage of it, I pre-set the location of crosswalk and street in the image (as shown in Figure 1, the crosswalk is highlighted in yellow and both sides of street in red). While the pre-set of crosswalk is represented in a form of convex polygon, both sides of the street are depicted by two parallel straight lines. These representations helped to determine the location of any pedestrian with respect to the crosswalk and the street. To recall, pedestrian’s location in the image is stored as co-ordinates of 4 corners of a rectangular box. In a 2D image, it is essential to measure each pedestrian’s location by a single (x,y) co-ordinate to make a concrete decision about their position with reference to crosswalk and street. If we observe the Figure 5, the lady is walking on the pavement towards the computer science building, but her head and center of body are still in the street (due to 2D image display) while legs are on the pavement. Similar observations in multiple images made me select the legs position to represent the pedestrian’s location because when pedestrian moves, legs represent the current location in the 2D image.
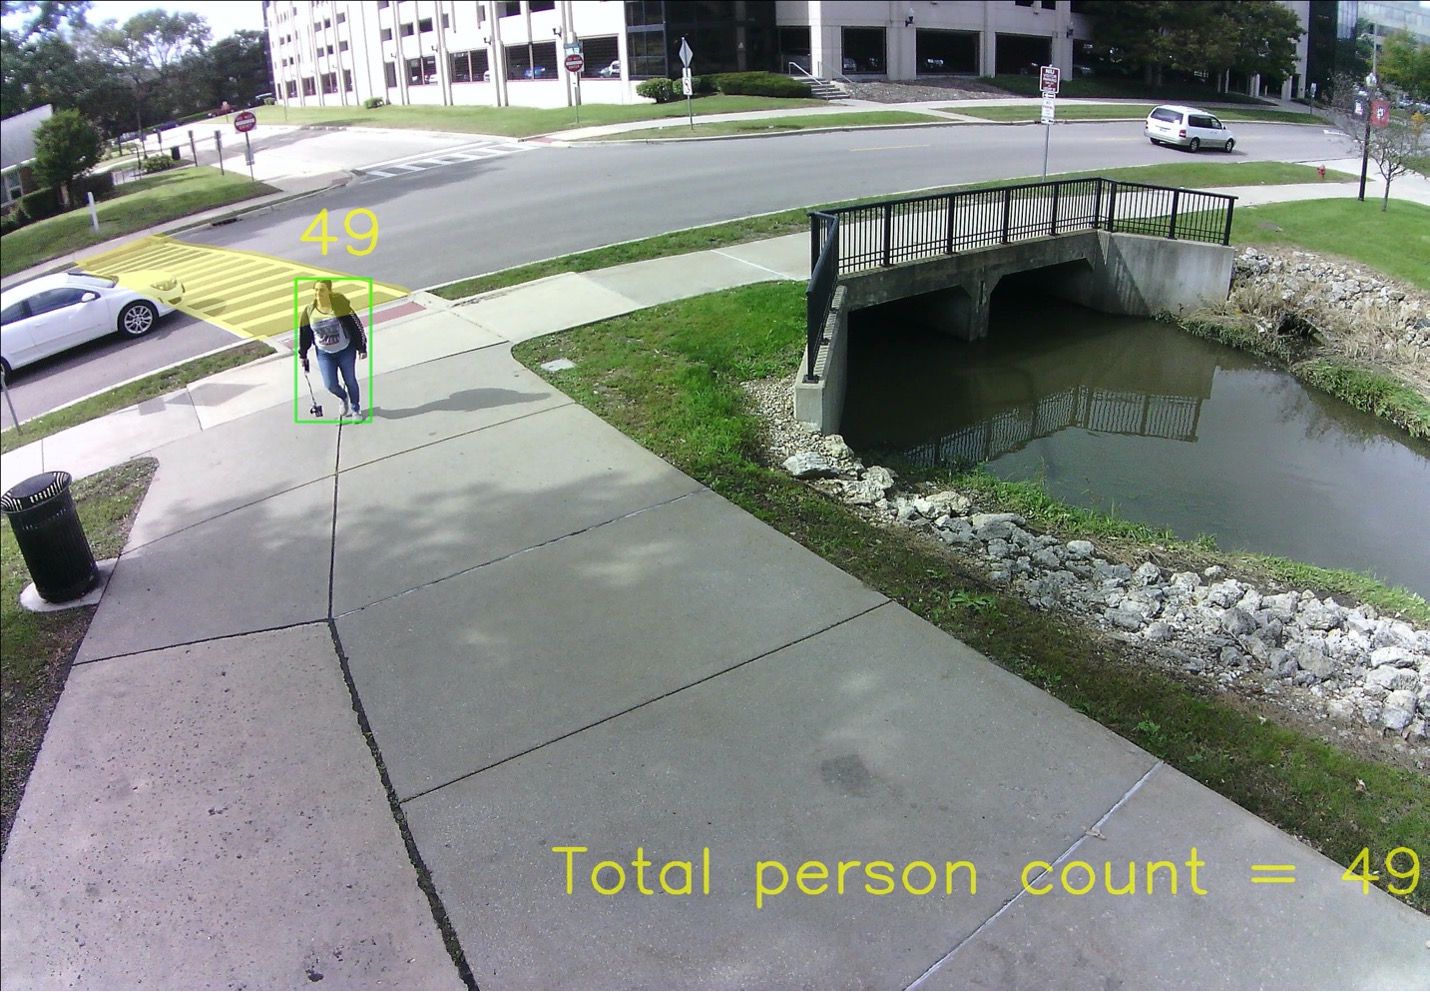
Figure 5 : Our algorithm detects that a person has crossed the street.
Now that a pedestrian’s position has been established, I will briefly discuss about the simple rules to determine if a pedestrian has crossed the street and followed/ violated the crosswalk. A pedestrian is considered to have crossed the street if they are detected on both sides of the street within a fixed time. To recall, the street has been represented by two straight lines, one for each side (as shown in red in Figure 1). The sign of these straight lines against the pedestrian’s coordinates exhibits their position relative to the street. For example, as we see in Figure 6, points A and B are in opposite sides of the straight line which can be verified by putting the value of these points coordinates in the line equation. While the value for point A is -2, for point B it is +3. Opposite signs of both points resemble that they are in opposite sides of the straight line. By similar means, we can compute if the pedestrian has been present to both sides of the street which will confirm that the pedestrian has crossed it. Additionally, to determine if the pedestrian has used the crosswalk, we can similarly verify their positions in the middle of the street. If all of their detected positions are inside the crosswalk polygon, I consider that the pedestrian has used the crosswalk. Using these 2 metrics, the count for crosswalk violations can be easily computed.
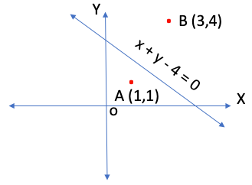
Figure 6: Determining the position of the points with respect to the straight line Future Works
In the current study, the implemented system is able to count the pedestrians who violates the crosswalk. Currently, data processing and AI algorithms execute on a server located in computer science building where AoT node periodically stores the images. Many images are lost due to wireless nature of communication. One potential solution can be to implement the algorithms on the AoT node and only transmit the results (instead of images) to server to reduce the overhead on wireless connection significantly. Further, I would like to generalize the system for other sites as well. For that, algorithms have to identify the street and crosswalk automatically in the image.
References
- A CDC Report on pedestrian Safety. (2020, March 06). Retrieved December 22, 2020, from https://www.cdc.gov/transportationsafety/pedestrian_safety/index.html
- P. Beckman, R. Sankaran, C. Catlett, N. Ferrier, and M. Papka, “Waggle: An open sensor platform for edge computing,” in 2016 IEEE Sensors, 2016, pp. 1-3.
- T. Lin, M. Maire, S. Belongie, J. Hays, P. Perona, D. Ramanan, P. Dollár, and C. Zitnick. “Microsoft coco: Common objects in context.” In European conference on computer vision, pp. 740-755. Springer, Cham, 2014.
- K. He, G. Gkioxari, P. Dollár, and R. Girshick. “Mask r-cnn.” In Proceedings of the IEEE international conference on computer vision, pp. 2961-2969. 2017.
- B. Zoph, V. Vasudevan, J. Shlens, and Q. V. Le, “Learning transferable architectures for scalable image recognition,” in Proc. IEEE Conf. CVPR, Jun. 2017, pp. 8697–8710.
- L. Zheng, L. Shen, L. Tian, S. Wang, J. Wang, and Q. Tian. “Scalable person re-identification: A benchmark.” In Proceedings of the IEEE international conference on computer vision, pp. 1116-1124. 2015.
- K. Zhou, Y. Yang, A. Cavallaro, and T. Xiang. “Omni-scale feature learning for person re-identification.” In Proceedings of the IEEE International Conference on Computer Vision, pp. 3702-3712. 2019.
- K. Zhou, and T. Xiang. “Torchreid: A library for deep learning person re-identification in pytorch.” arXiv preprint arXiv:1910.10093 (2019).
- Tensorflow. “Tensorflow/Models.” GitHub, github.com/tensorflow/models.