Exploring the Potential for Edge Computing to Collect Novel Biotic Interaction Data
Kyle Lima
klima@schoodicinstitute.org
University of Maine, Schoodic Institute at Acadia National Park
Introduction
Biodiversity is essential for ecosystem functioning and the provisioning of ecosystem services but is increasingly threatened by global change. Global change is impacting species abundances, distributions, and biotic interactions causing novel ecological communities, and doing so at rates more rapidly than ever before. Understanding and mitigating these changes has therefore become critical to biodiversity conservation.
However, predicting biodiversity responses to global change remains challenging because the ecological processes that shape species populations and communities operate across multiple spatial and temporal scales. Species distributions and community composition emerge from interactions among processes ranging from local-scale habitat conditions and species interactions to landscape-scale environmental gradients and regional climate patterns. This is a central challenge in ecology, processes governing biodiversity are inherently scale dependent, yet most predictive models assume that relationships between biodiversity and other drivers remain constant across scales. While studies have modeled how geophysical and biological drivers (i.e., forest structure, topographic characteristics, landscape composition and configuration) influence biodiversity across multiple spatial and temporal scales, most approaches only emphasize coarse climate or landscape patterns and overlook other important drivers that shape ecological communities.
Perhaps the greatest remaining challenge in predictive ecology is incorporating biotic interactions into models of biodiversity change. Although ecological theory recognizes species interactions as fundamental determinants of biodiversity, they are rarely incorporated into models because they are difficult to quantify consistently across broad spatial and temporal extents. While studies have shown the importance of biotic interactions on species distributions and community composition, we don't understand how these effects operate at different scales, i.e. the Raunkiaeran shortfall, especially in relation to other drivers. Similarly, we don't know how biotic interactions relate to other critical components of biodiversity distribution like geophysical characteristics (e.g., climate, roughness, topographic complexity, etc.) which inherently mediate the importance of biological drivers like biotic interactions.
Project Overview
This project begins to explore the ability of AI to collect biotic interaction data by working with the Sage Grande Testbed and applying a simple example model at the edge. We compare two foundation models (BioCLIP and DINOv3) with a few different classification heads trained on the same data to perform the same task: classify an image to a certain biotic interaction type. We took the top model and published an application on a Sage Node to provide a proof of concept example classifying interactions from images at the edge.
The application, BISONN (Biotic Interactions with Sage Observations using Neural Networks), focuses on detecting bird mobbing behavior, an anti-predator interaction in which a single or multiple birds harass a predator. Mobbing occurs year-round though it is more common during the breeding season, is context-dependent, and difficult to observe systematically, making it an ideal candidate for automated, continuous camera-based detection on distributed environmental sensor nodes. In addition to classifying behavior, BISONN also performs zero-shot species identification on each image, leveraging BioCLIP's text encoder to identify which North American bird species are present — a capability that requires no additional training data because BioCLIP was explicitly trained on species captions.
Sage/Waggle is an edge computing platform that deploys containerized plugins on networked environmental sensor nodes (Thors). Each node runs k3s/Kubernetes and can be equipped with cameras, microphones, and other sensors. Plugins process sensor data locally at the edge and publish results to a cloud data pipeline, enabling real-time monitoring without continuous human oversight.
Methods and Results
Data
We assembled a labeled dataset of 1,690 bird images for binary classification of mobbing behavior:
| Class | iNaturalist | Wikimedia Commons | Personal | Total |
|---|---|---|---|---|
| mobbing | 0 | 98 | 3 | 101 |
| none | 78 | 29 | 1,482 | 1,589 |
| Total | 78 | 127 | 1,485 | 1,690 |
Images were sourced from iNaturalist (Creative Commons-licensed via API), Wikimedia Commons, and personal field photography. The none class consists of bird images with no mobbing interaction: perched birds, flying birds, foraging birds, and solitary individuals. This serves as the background rejection class. The dataset exhibits significant class imbalance (1:16, mobbing:none), which we address through class-weighted training.
All images were manually reviewed. Non-bird images flagged by BioCLIP zero-shot classification were removed from the none folder (bones, droppings, mammals, plants, insects). Thirty-six images originally classified as mobbing were reclassified to none after manual inspection.
Dataset Split
We use a stratified 75/15/15 train/validation/test split (seed=42): 75% for training, 15% as a held-out validation set for model selection, and 15% as a final test set for reporting generalization performance. The validation set is used to select the best classification head per backbone — the test set is never used for any model selection decisions, ensuring an honest estimate of generalization performance. The same split and seed are used across all backbones for comparability.
| Split | Total | Mobbing | None |
|---|---|---|---|
| Train | 1,182 | 71 | 1,111 |
| Validation | 254 | 15 | 239 |
| Test | 254 | 15 | 239 |
Foundation Models
We compared two foundation model families as frozen visual feature extractors:
BioCLIP 2.5 Huge (imageomics/bioclip-2.5-vith14) is a CLIP-style vision-language model pretrained on the TreeOfLife-200M dataset — a large-scale collection of biological image-text pairs with taxonomically rich captions. It uses a ViT-H/14 backbone (~1 billion parameters) and produces 1,024-dimensional image embeddings. Because BioCLIP was trained on biological captions that include species names and morphological descriptions, its visual features capture biologically relevant cues that may extend beyond taxonomy to behavioral context. BioCLIP also has a text encoder, enabling zero-shot text-image retrieval — a capability DINOv3 lacks.
DINOv3 (available in timm as vit_{small,large}_patch16_dinov3) is a self-supervised vision transformer trained purely on image augmentations with no text or captions. We tested two sizes: DINOv3 Large (~300M parameters, 1,024-dim embeddings) and DINOv3 Small (~22M parameters, 384-dim embeddings). DINOv3 has no text encoder and cannot perform zero-shot classification, but its self-supervised contrastive training produces features with strong local neighborhood structure that may benefit instance-level tasks.
Embedding Extraction
For each backbone, we extracted L2-normalized embeddings for all 1,690 labeled images using an EmbeddingBundle pattern (ordered IDs, L2-normalized features, SHA-256 producer manifest) adapted from the Imageomics BioCLIP workshop. BioCLIP 2.5 embeddings were extracted on CPU in ~37 minutes (~1.3s/image). DINOv3 Large required ~23 minutes (~0.8s/image), and DINOv3 Small ~6 minutes (~0.2s/image). All embeddings and bundles were verified for correct shape, L2 normalization, and absence of NaNs.
For BioCLIP, we also encoded 16 hand-authored behavior prompts (8 mobbing, 8 none) through the text encoder with normalize=True to enable zero-shot classification via cosine similarity between text and image embeddings.
Classification Heads
On each backbone's frozen embeddings, we trained three lightweight classification heads using scikit-learn:
- Logistic Regression (linear probe) —
class_weight='balanced',max_iter=2000 - Linear SVM —
kernel='linear',class_weight='balanced' - k-Nearest Neighbors —
k=5, cosine metric, distance-weighted voting
The class_weight='balanced' parameter is critical: without it, the 1:16 class imbalance causes the classifier to trivially predict none for every image. With balanced weighting, the classifier assigns higher misclassification costs to the minority mobbing class, counteracting the imbalance.
For BioCLIP only, we also evaluated zero-shot retrieval — classifying each image by cosine similarity to the encoded behavior text prompts (no training data required). Two voting schemes were tested: averaged class prototypes and best-of-prompts (max individual prompt score).
All models were evaluated on an 80/20 stratified train/test split (seed=42), with the same split used across all backbones for comparability.
Species Identification
Behavior classification and species identification are fundamentally different tasks for BioCLIP. The zero-shot evaluation above demonstrated that behavior prompts fail (44.9% accuracy) because BioCLIP's text encoder was trained on taxonomic captions, not behavior descriptions. However, species identification is the task BioCLIP was explicitly trained on via TreeOfLife-200M — it should excel here without any supervised training.
We curated a list of 30 North American bird species as text prompts, selected to cover the species most relevant to mobbing interactions:
- Corvids (frequent mobbers): American Crow, Common Raven, Blue Jay, Steller's Jay, Black-billed Magpie, Fish Crow
- Raptors (frequent mobbing targets): Red-tailed Hawk, Cooper's Hawk, Sharp-shinned Hawk, Broad-winged Hawk, Great Horned Owl, Barred Owl, Eastern Screech-Owl, Northern Saw-whet Owl, Peregrine Falcon, American Kestrel, Bald Eagle, Turkey Vulture, Zone-tailed Hawk
- Songbirds (common mobbing participants): Black-capped Chickadee, Tufted Titmouse, Red-breasted Nuthatch, White-breasted Nuthatch, Downy Woodpecker, Northern Cardinal, American Robin, Gray Catbird, Common Grackle, Red-winged Blackbird
Each species name is encoded as a text prompt using the "a photo of a <species>" framing to match BioCLIP's training format. At inference time, the image embedding is compared against all 30 species text embeddings via cosine similarity (both are L2-normalized, so the dot product equals cosine similarity). The top-3 species and their similarity scores are published alongside the behavior classification.
This zero-shot approach requires no labeled species data and no training — the species list can be extended or modified by simply editing the prompt list, making it adaptable to different regions or research questions.
Results
Cross-Model Comparison
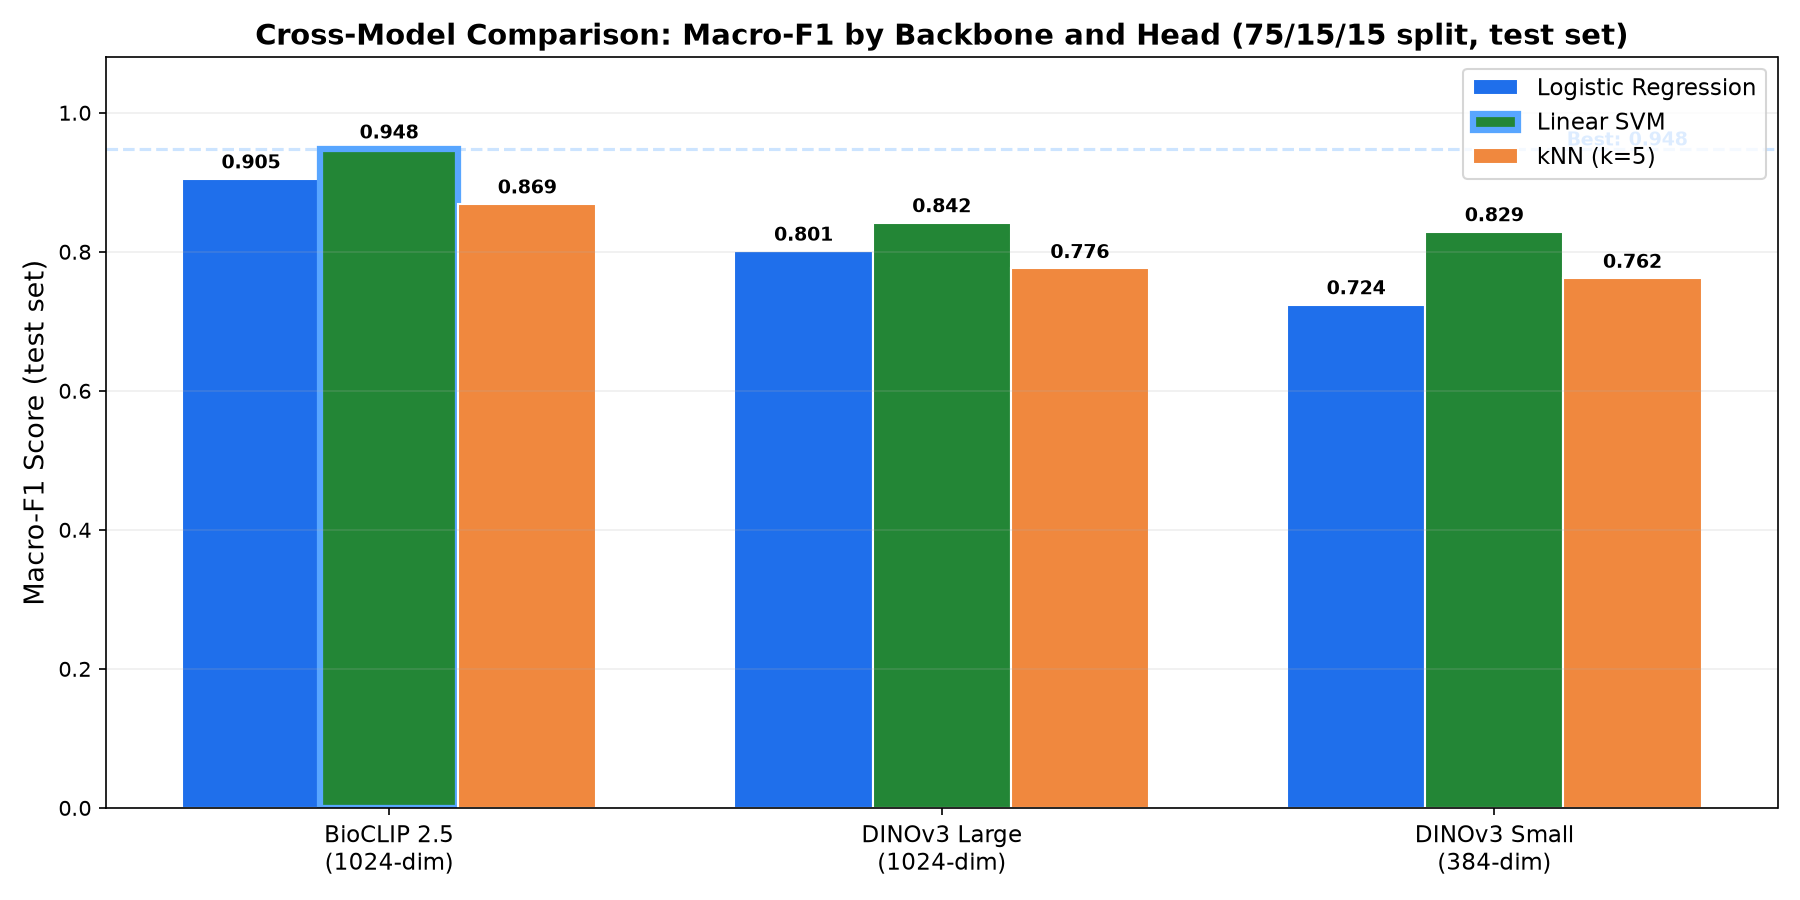
The best overall model was BioCLIP 2.5 + Linear SVM, achieving 98.8% accuracy, 0.948 macro-F1, and 0.903 mobbing F1 on the held-out test set. Model selection was performed on the validation set (val macro-F1=0.965); the table below shows final test-set metrics:
| Backbone | Head | Dim | Val F1 | Test Accuracy | Test Macro-F1 | Mobbing F1 | None F1 |
|---|---|---|---|---|---|---|---|
| BioCLIP 2.5 | Logistic Reg | 1024 | 0.919 | 0.976 | 0.905 | 0.824 | 0.987 |
| BioCLIP 2.5 | Linear SVM | 1024 | 0.965 | 0.988 | 0.948 | 0.903 | 0.994 |
| BioCLIP 2.5 | kNN (k=5) | 1024 | 0.841 | 0.976 | 0.869 | 0.750 | 0.988 |
| DINOv3 Large | Logistic Reg | 1024 | 0.819 | 0.945 | 0.801 | 0.632 | 0.970 |
| DINOv3 Large | Linear SVM | 1024 | 0.880 | 0.961 | 0.842 | 0.706 | 0.979 |
| DINOv3 Large | kNN (k=5) | 1024 | 0.878 | 0.965 | 0.776 | 0.571 | 0.982 |
| DINOv3 Small | Logistic Reg | 384 | 0.704 | 0.906 | 0.724 | 0.500 | 0.948 |
| DINOv3 Small | Linear SVM | 384 | 0.777 | 0.953 | 0.829 | 0.684 | 0.974 |
| DINOv3 Small | kNN (k=5) | 384 | 0.853 | 0.961 | 0.762 | 0.545 | 0.979 |
Confusion Matrices
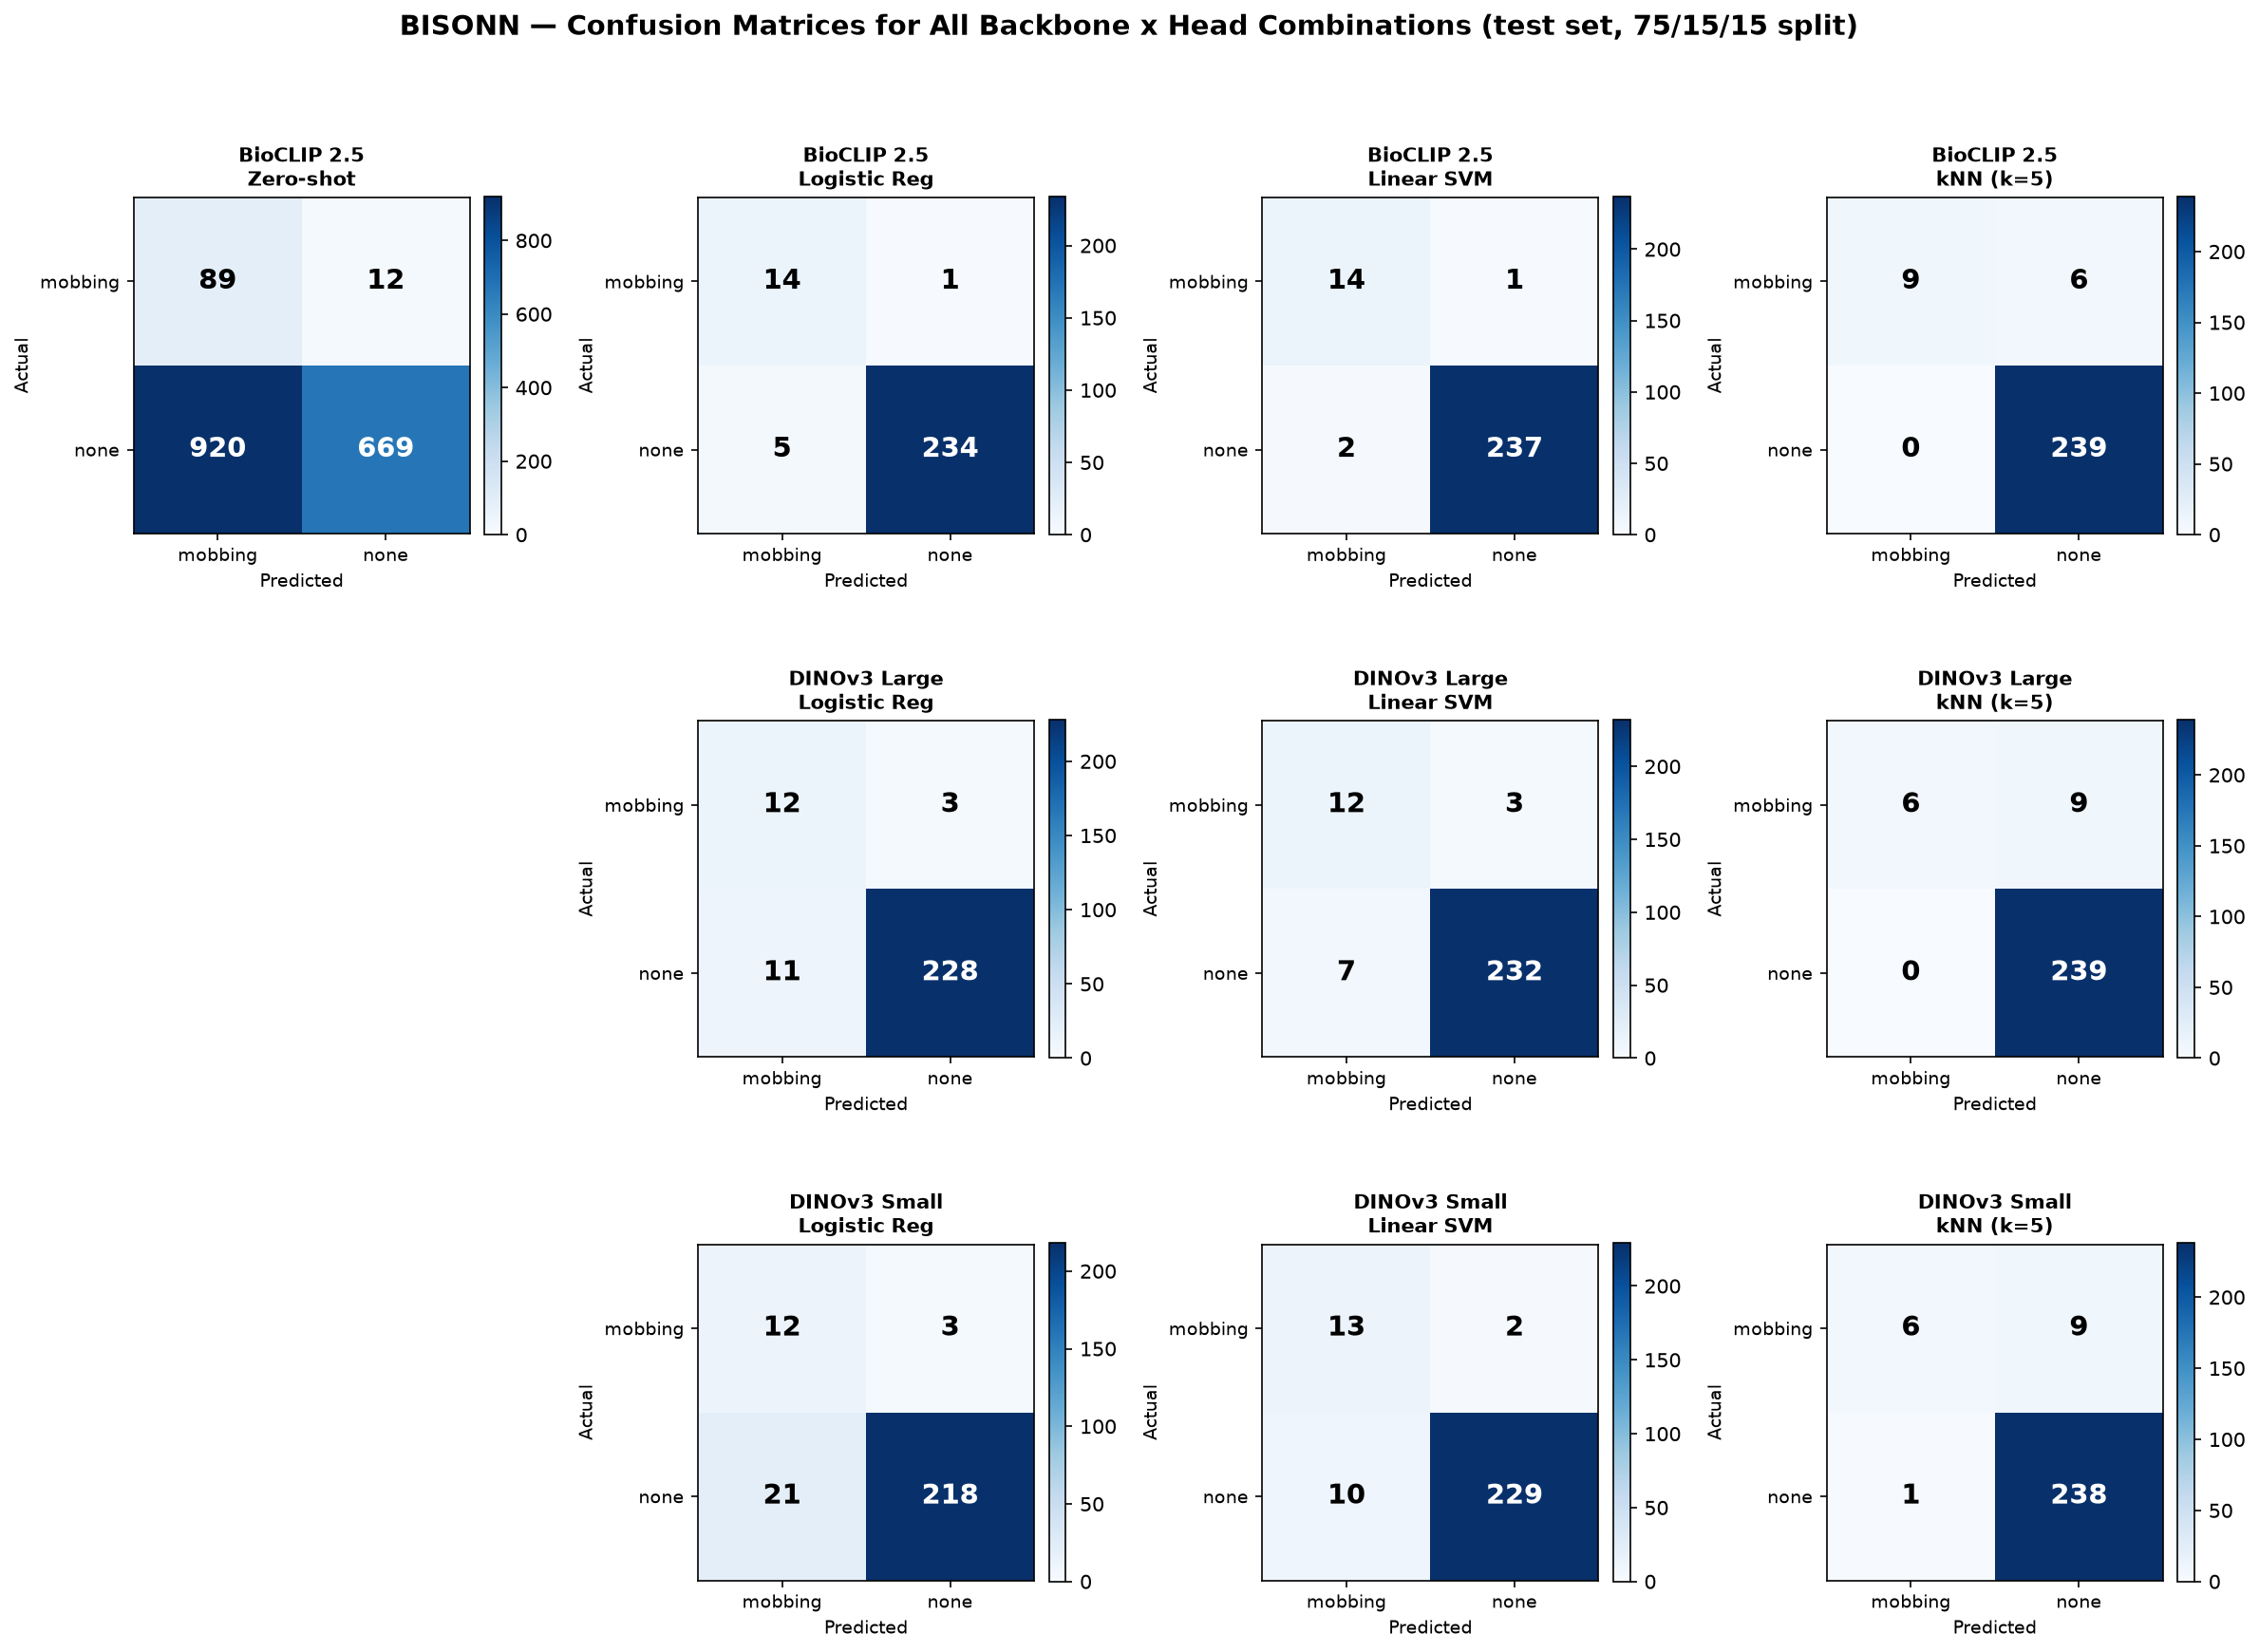
The confusion matrix for the best model (BioCLIP 2.5 + Linear SVM) on the 254-image test set shows strong performance on both classes — 14 of 15 mobbing images correctly detected (93.3% recall), with only 2 false positives among 239 none images (99.2% specificity):
Key Findings
-
BioCLIP 2.5 dominates DINOv3 on mobbing detection. BioCLIP's best test macro-F1 (0.948) exceeds DINOv3 Large's best (0.842) by over 10 points. Despite BioCLIP being trained on species captions rather than behavioral descriptions, its biologically pretrained visual features separate mobbing from non-mobbing better than DINOv3's general-purpose self-supervised features. This suggests bird images contain taxonomic-visual cues correlated with behavioral context — species that participate in mobbing (corvids, raptors, small passerines) may be visually distinctive in BioCLIP's embedding space.
-
Linear SVM is the best classification head. BioCLIP embeddings are largely linearly separable — a simple linear decision boundary outperforms both logistic regression and kNN. The SVM model is only 1.7 MB, making it trivially small to package for edge deployment.
-
Zero-shot classification is poor (44.9% accuracy, 0.375 macro-F1). BioCLIP's text encoder was trained on taxonomic captions, not behavior descriptions. Hand-authored behavior prompts ("birds mobbing a predator," "songbirds mobbing an owl") do not produce useful zero-shot prototypes — the model over-predicts mobbing heavily (982 false positives). This confirms that supervised training on labeled examples is necessary for behavioral classification, even with a biologically pretrained foundation model. Note that zero-shot is evaluated on the full dataset (no train/test split needed) since it requires no training.
-
DINOv3 Large does not justify its cost over Small. DINOv3 Small's best test macro-F1 (0.829 with Linear SVM) is comparable to DINOv3 Large's best (0.842), but Large requires 300M parameters (23-minute extraction) versus Small's 22M parameters (6-minute extraction). For edge deployment where compute and memory are constrained, DINOv3 Small is the clear choice if DINOv3 is used.
-
kNN is competitive on validation but degrades on the test set. DINOv3 Small's kNN achieved the highest val macro-F1 (0.853) among DINOv3 Small heads, but dropped to 0.762 on the test set — suggesting overfitting to the validation set's local neighborhood structure. BioCLIP's global linear structure consistently favors a learned decision boundary (SVM) over nearest-neighbor voting.
-
Mobbing precision is the key weakness for DINOv3. All DINOv3 configurations produce more false positives than BioCLIP's Linear SVM (7-21 false positives vs. 2), limiting their practical utility for mobbing detection where false alerts reduce trust in the system.
Edge Deployment
The best model (BioCLIP 2.5 + Linear SVM) was packaged as a Sage/Waggle plugin and deployed on a Thor edge computing node (sgt-thor-1423125006073-H021, JetPack R38.2.1, aarch64, 128 GB unified memory). The plugin pipeline operates as follows:
Camera snapshot → BioCLIP 2.5 encode (1024-dim, L2-normalized) → SVM classify
   → publish biotic.interaction.bird_mobbing (1=mobbing, 0=none)
   → cosine similarity vs species text prompts → publish biotic.species (top-3)
   → optionally upload annotated image for human review
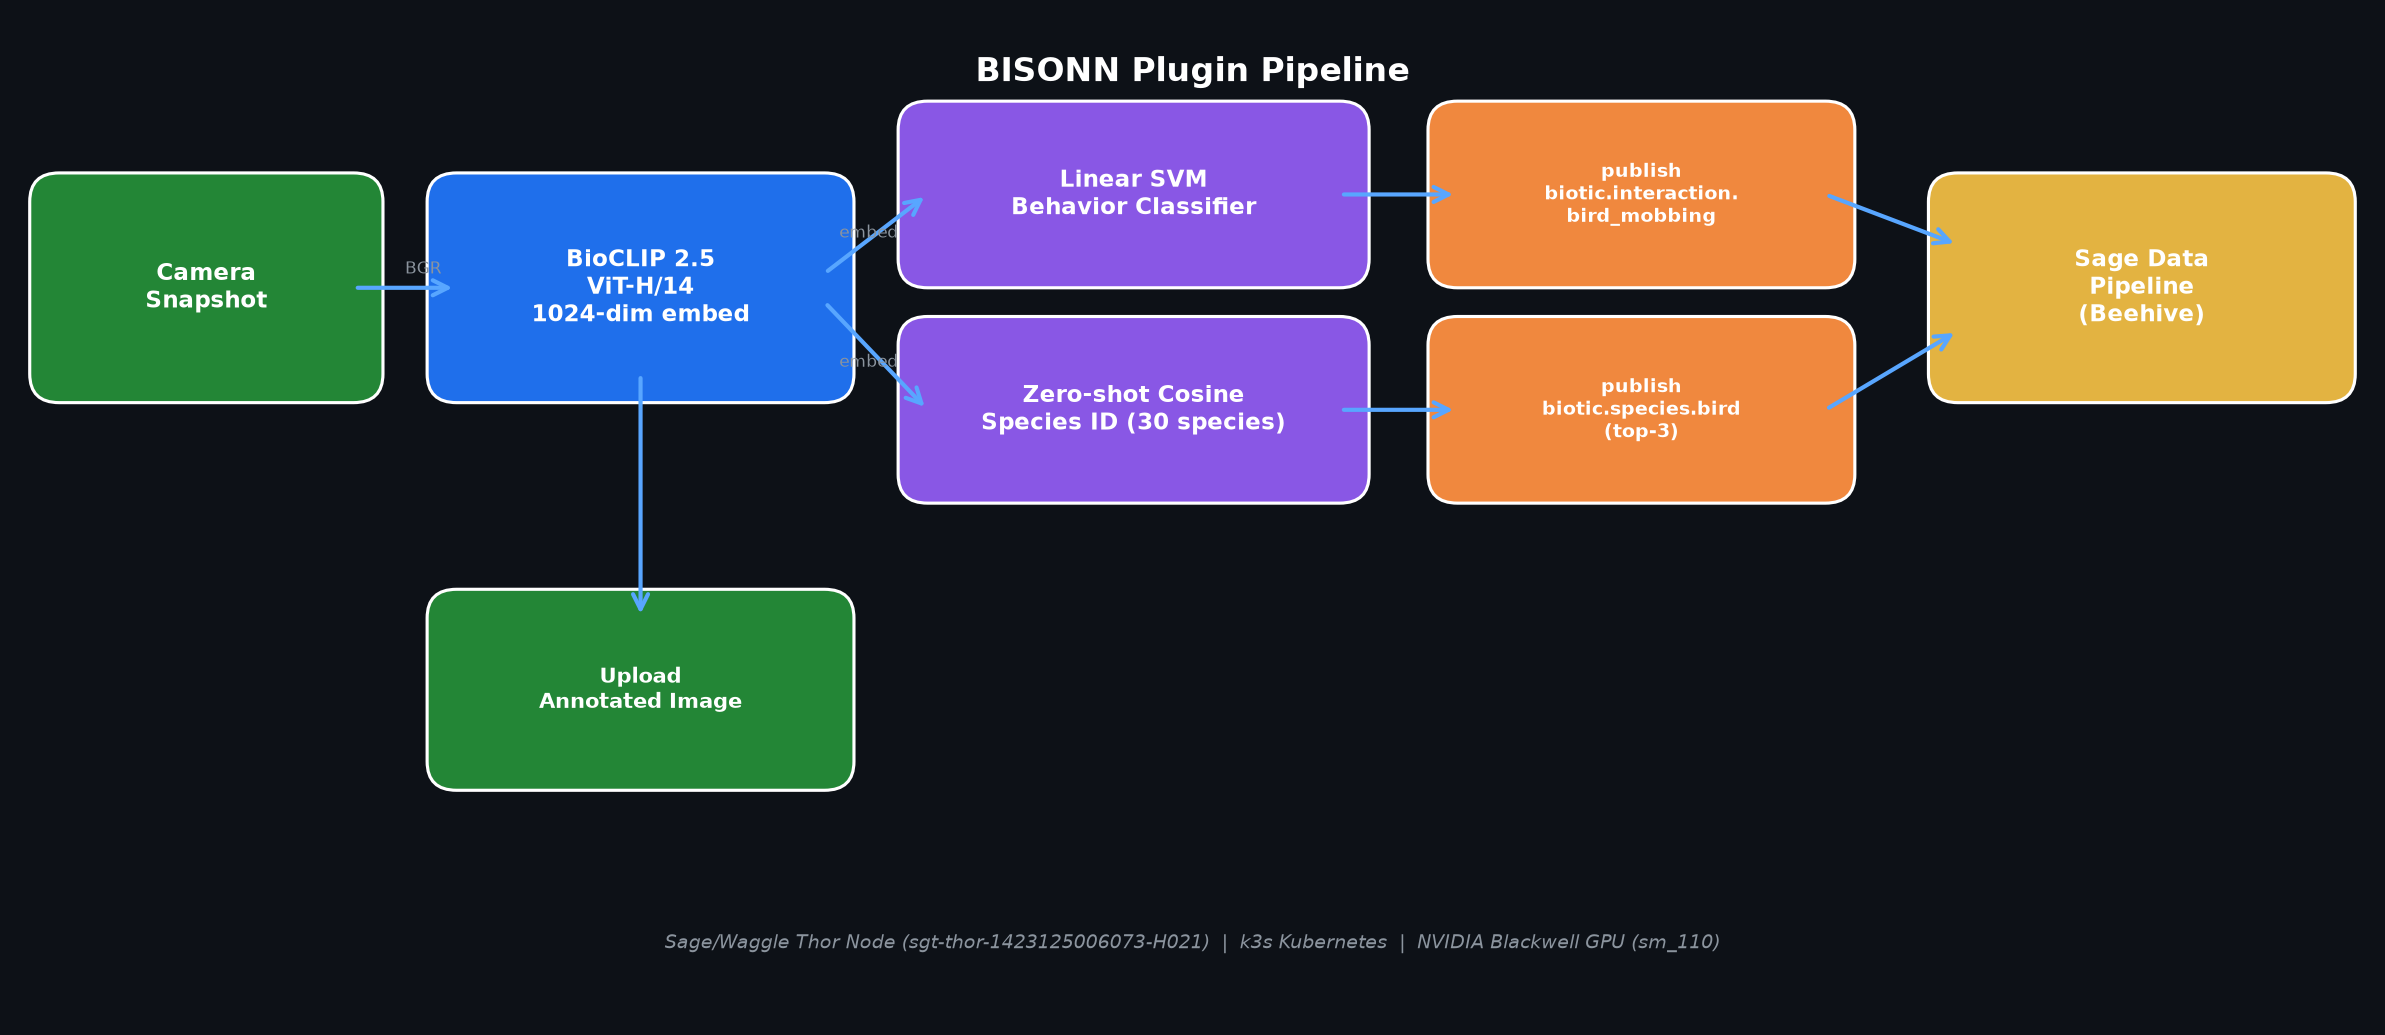
The plugin was built as a Docker container using the NVIDIA PyTorch 25.08 base image (CUDA 13.0, PyTorch 2.8) which supports the Thor's Blackwell GPU architecture (sm_110). BioCLIP 2.5 weights (~1 GB) and the SVM classifier (1.7 MB) are baked into the image at build time, enabling offline inference at runtime. The container was built with podman locally and side-loaded into the k3s containerd registry (15.6 GB image), bypassing the Sage ECR build system which was broken at the time of deployment.
A one-shot test with two sample images confirmed correct behavior:
| Test Image | Predicted | Confidence | Correct? |
|---|---|---|---|
| mobbing_sample.jpg | mobbing | 0.731 | ✓ |
| none_sample.jpg | none | 0.919 | ✓ |
Both predictions were published to the Sage data pipeline via biotic.interaction.bird_mobbing. The plugin runs on CPU (~2 seconds per image), which is adequate for a 30-second capture interval. GPU access can be requested via --selector resource.gpu=true for faster inference.
In addition to behavior classification, the plugin now includes zero-shot species identification using BioCLIP's text encoder. A curated list of 30 North American bird species — emphasizing mobbing-relevant corvids (crows, ravens, jays), raptors (hawks, owls, falcons, eagles), and common songbird participants (chickadees, titmice, nuthatches, woodpeckers) — is encoded as text prompts at startup. For each camera snapshot, the image embedding is compared against all species text embeddings via cosine similarity, and the top-3 species predictions are published alongside the behavior classification. This leverages BioCLIP's core strength: unlike behavior classification (where zero-shot fails), species identification is the task BioCLIP was explicitly trained on via TreeOfLife-200M.
Future Directions
The long-term goals are to integrate multiple sensors (acoustic recording units, video, image) to monitor for interactions more effectively and to develop a more powerful, well trained version of this application to classify more types of biotic interactions. We would also like to scale data collection across the SGT network as well as integrate with NEON sites. The current 30-species list for zero-shot identification is curated for North American mobbing contexts and can be easily extended to cover additional species by editing the text prompt list in the plugin code — no retraining is required, only a container rebuild.