Manoomin Vision
Authors: Jordan Gurneau (Northwestern University), Ella Neumann (Georgia Tech / MIT), Dave MacDonald (UC Davis), Deanna DiMonte (Northwestern University), and Morty (lead)
Project: Using vision models to track wild rice (manoomin / Zizania palustris) life-stage across a growing season, from a fixed Sage edge-node camera (W083, Bad River marsh). Short-term goal: a small-scale test (10-150 images) producing real data/analysis before scaling to the full multi-year dataset.
Data
- Source: Sage node W083 bottom camera, pulled via the Sage data API (public metadata + authenticated image download).
- Pull: one midday frame (best light, ~13:00 local) per date across the 2025 growing season, May 1 – Sep 30 → 146 dates, 146 images, 0 failures.
- Labeling: manually labeled by life stage per date — Submerged, Floating Leaf, Emergent Leaf, Flowering, Seed Producing, Shattering, Senescence (multi-label; stages can co-occur). 115 of 146 dates labeled.
- Split by date, not by image, since frames are only meaningfully independent at the date level.
| Submerged (May) | Flowering (July) |
|---|---|
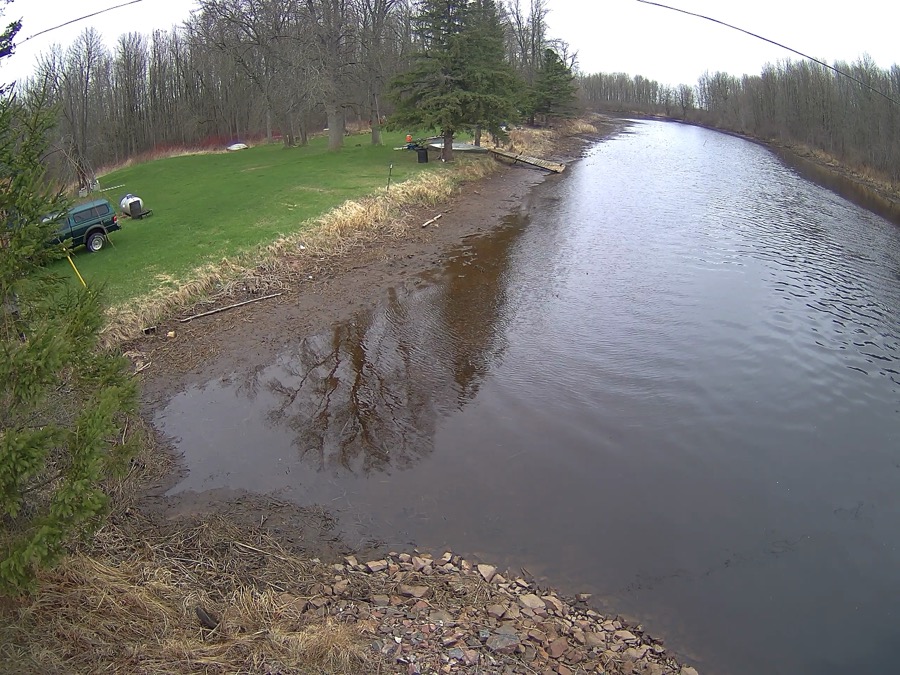 | 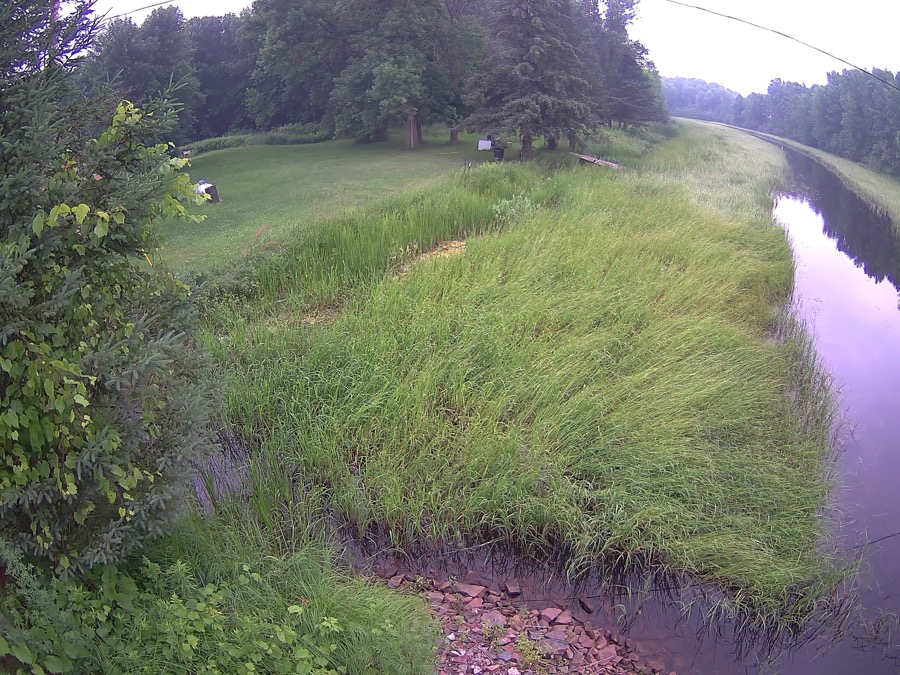 |
Model
Ran the 146-image set through BioCLIP (Imageomics), evaluated using the BioBench frozen-embedding framework — no fine-tuning, just encode each image and inspect the resulting feature space.
Result
Frozen BioCLIP embeddings, computed with no labels involved, organize into a continuous trajectory across the growing season. Coloring the same points by the independently-assigned life-stage labels shows the seven stages occupying distinct, contiguous, correctly-ordered regions of that trajectory (Submerged → Floating Leaf → Emergent Leaf → Flowering → Seed Producing → Shattering → Senescence).
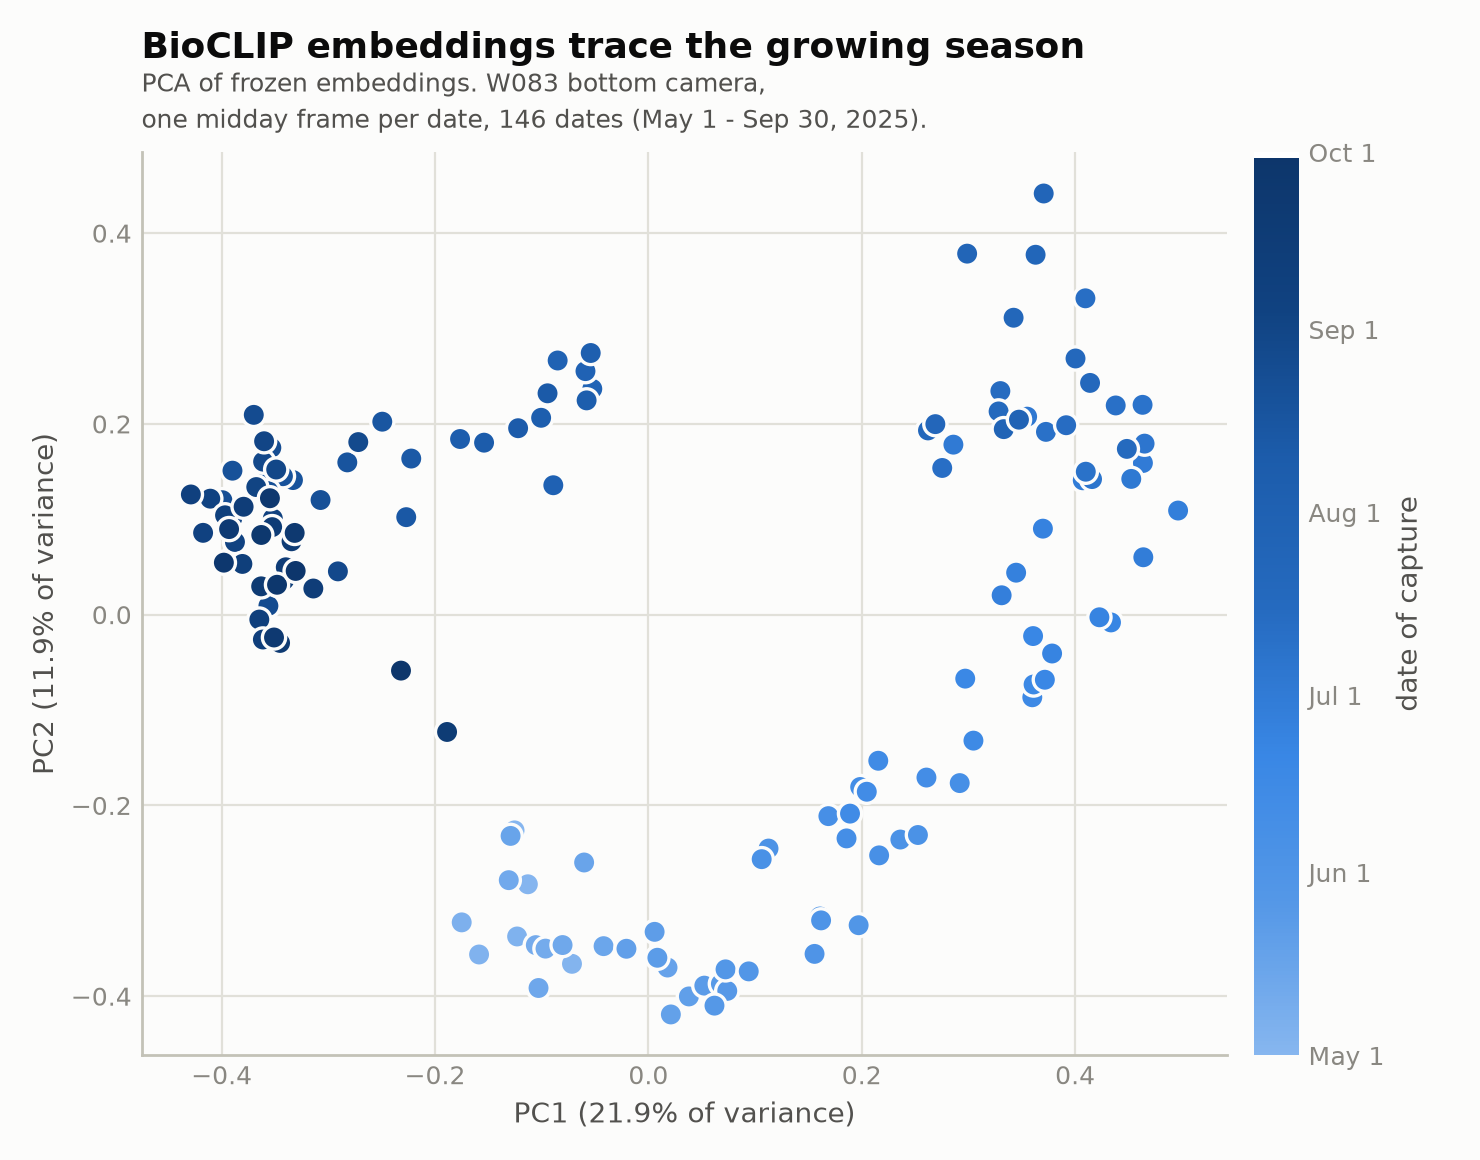
PCA of L2-normalized embeddings; PC1 explains 21.9% of variance, PC2 11.9%. Spearman correlation with day-of-year: PC1 ρ = -0.57 (p = 6.5e-14), PC2 ρ = +0.56 (p = 2.4e-13).
Caveat: stage is nearly a deterministic function of date in this dataset, so this shows BioCLIP recovers seasonal structure — not yet proof it responds to plant morphology specifically. A time-of-day stability check on a larger multi-frame-per-date pull is the planned next test for that.
Next
Leave-one-date-out regression on the full embedding (a single defensible
number), then a proper BioBench task (macro-F1 with bootstrap CIs) off the
fishnet template.