Multimodal Drought Early Warning at the Edge
Authors: Di Fan (University of Florida), Levi Johnson (Colorado State University), John Blackwell (Colorado State University), and Atefeh Hosseini (University of Kansas)
Introduction
Motivation
Drought affects water availability, ecosystem health, vegetation condition, agriculture, and wildfire risk. Regional drought products provide essential large-scale information, but local conditions can change between reporting cycles. Instrumented environmental sites offer a complementary view through frequent atmospheric, soil, and vegetation observations.
Using these observations in near real time is not straightforward. Environmental measurements may arrive at different times, individual sensors may be temporarily unavailable, and a recent landscape image may not yet have been collected. An edge system must therefore be able to analyze the information that is currently available, communicate when evidence is incomplete, and update its assessment when new observations arrive.
This project investigates multimodal drought early warning using the Sage edge-computing ecosystem. We use the National Ecological Observatory Network (NEON) Caddo–Lyndon B. Johnson National Grasslands site (CLBJ) in north-central Texas as an initial pilot. CLBJ provides a useful combination of atmospheric, soil, and PhenoCam observations in a Southern Plains environment.
Texas is used here as a starting example rather than the final geographic scope. Future work will extend the study to sites in Colorado, Wyoming, and other climate regions to examine how well the approach transfers across different ecosystems and sensor configurations.
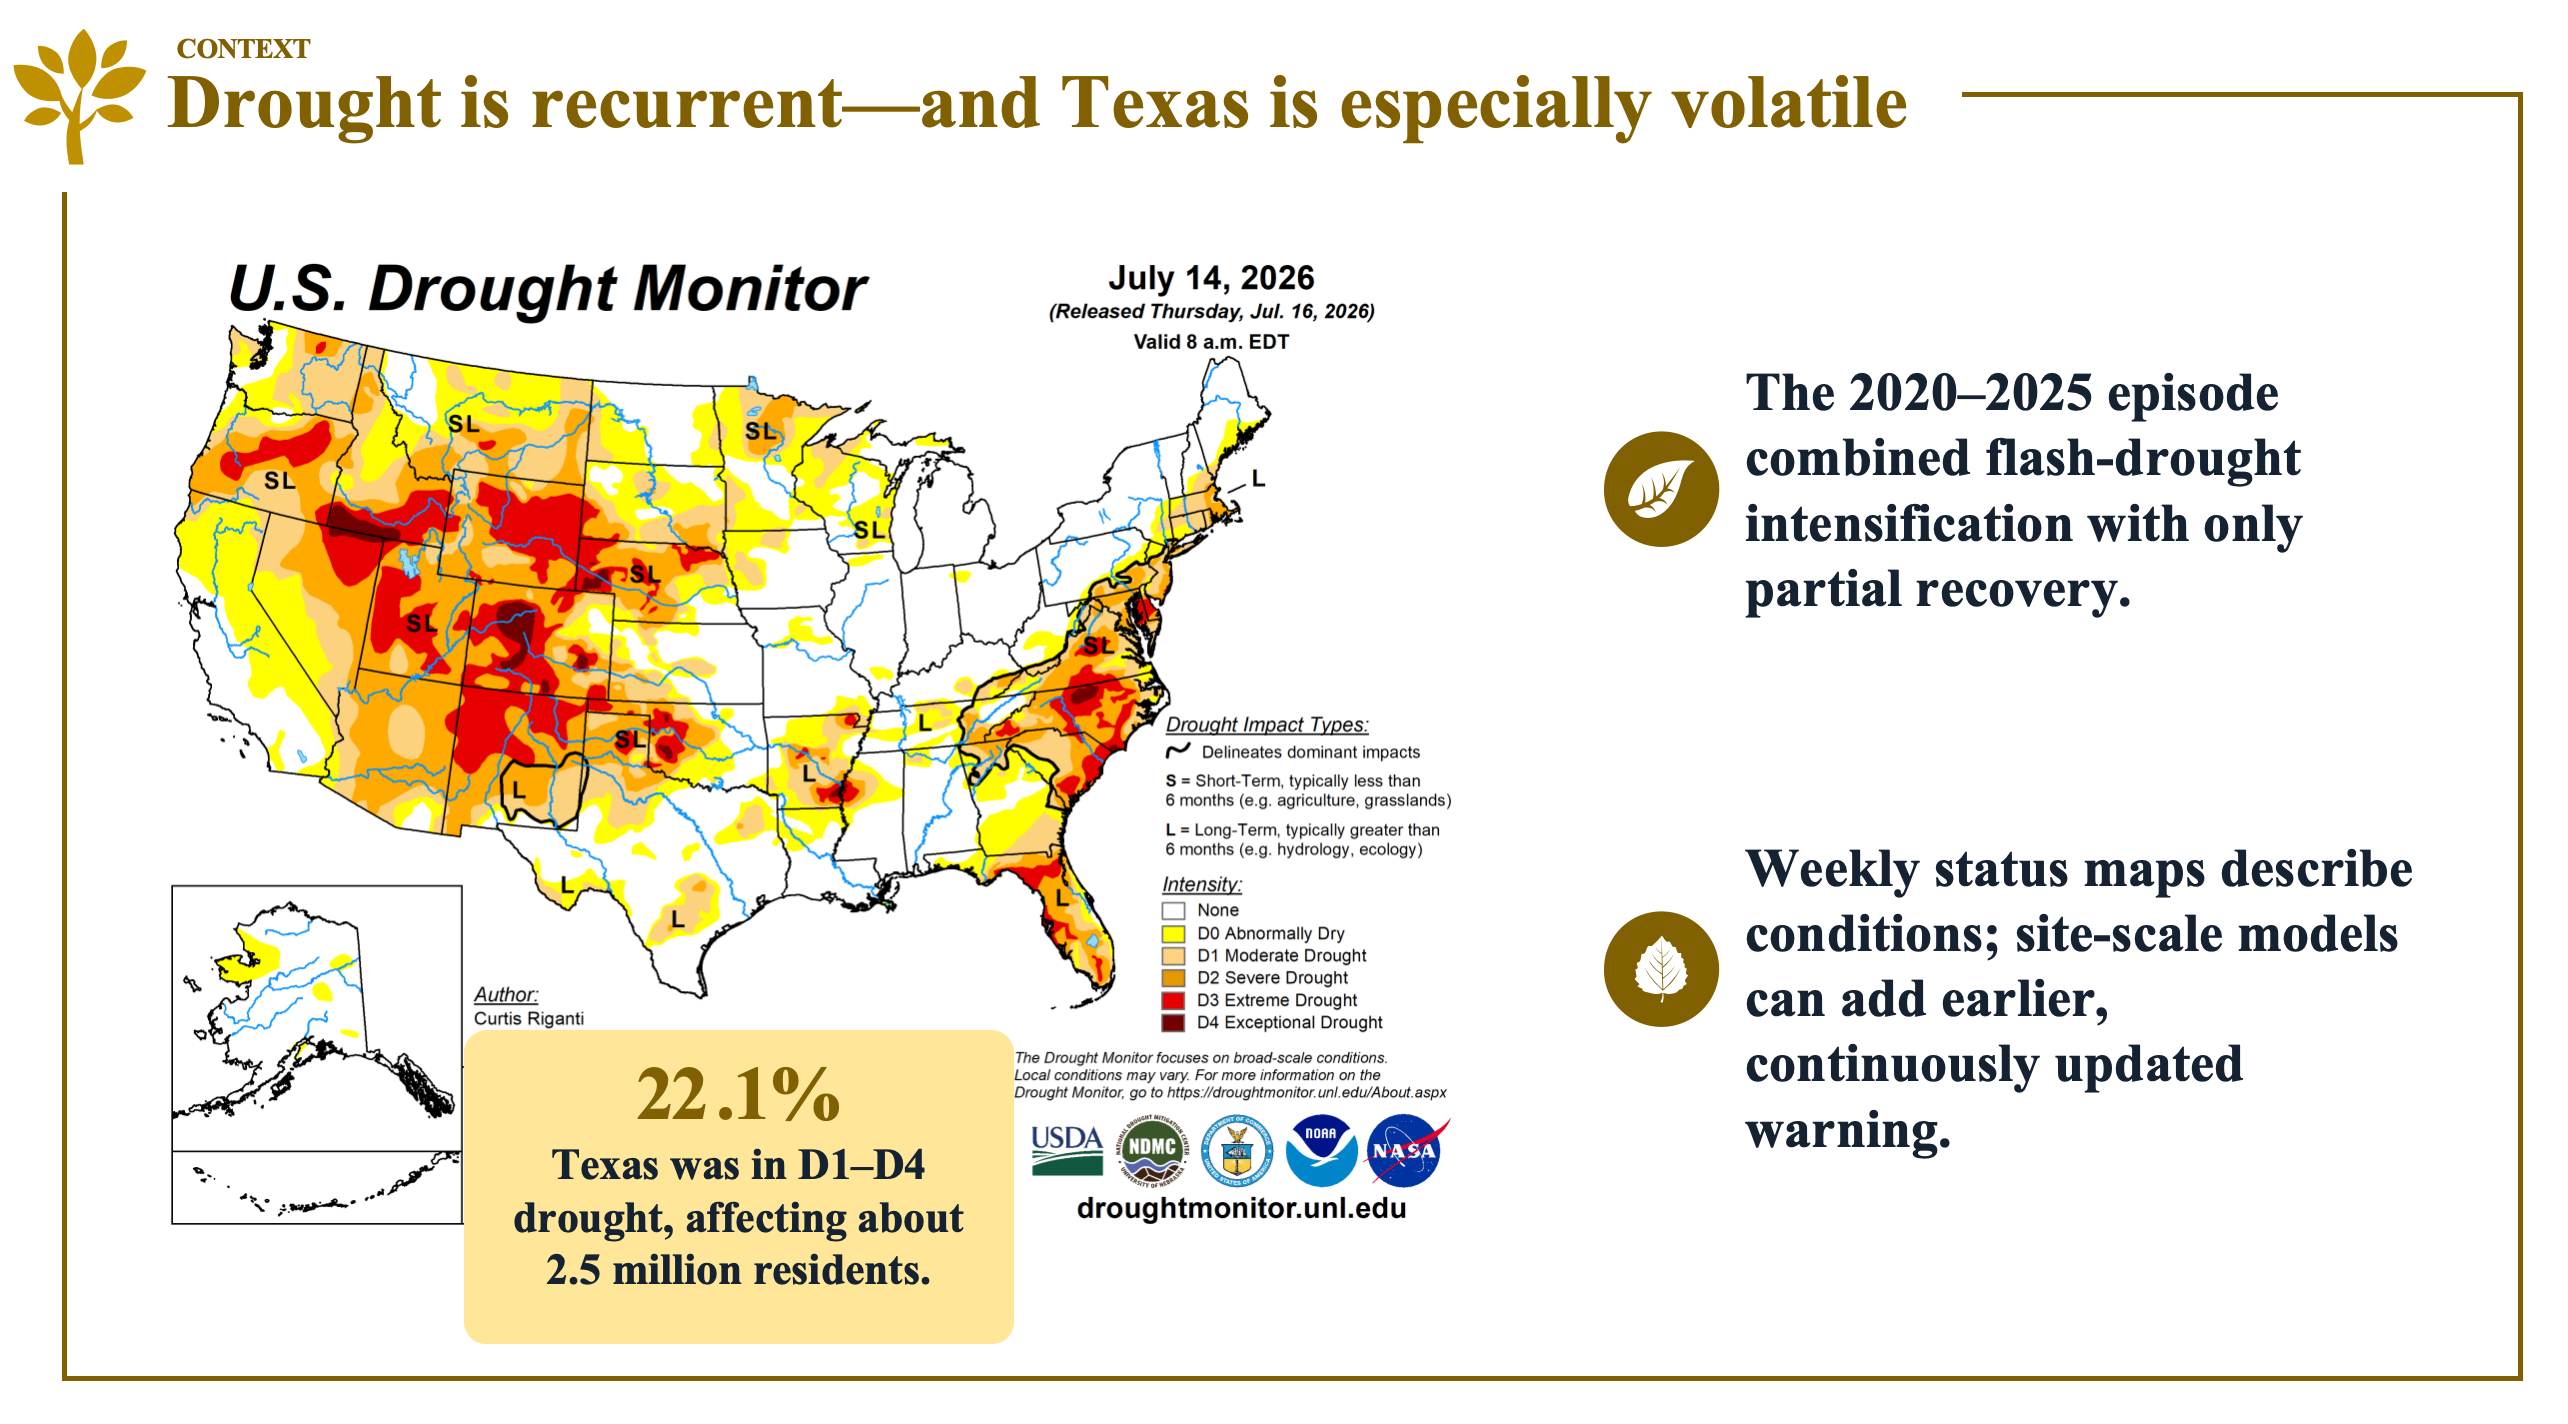
Figure 1 Motivation.
Our Work
We developed a research prototype that combines environmental sensor histories with landscape imagery to estimate current drought conditions and provide short-term outlooks. The system is designed around a realistic operational constraint: all expected inputs may not be available at the same moment.
Instead of requiring a complete synchronized record, the prototype tracks which observations are present, which are delayed, and how recently each source was updated. It can produce an initial result from partial information and revise the result after an additional sensor record or image becomes available.
The system also provides a natural-language analysis interface. The numerical forecast is generated first and then passed to a vision-language model for explanation. This design keeps the scientific prediction separate from the user-facing narrative.
The current prototype supports historical replay and analysis of newly supplied observations. It has also been migrated to an NVIDIA Thor development node to evaluate whether the workflow can operate in an edge-oriented environment. Automatic subscription to deployed Sage or NEON data streams remains future work.
Data
The pilot study uses archived NEON observations from CLBJ covering approximately five years. The available measurements include precipitation, air temperature, relative humidity, atmospheric pressure, radiation, wind, soil moisture, soil temperature, soil carbon dioxide, and soil heat flux.
Daily PhenoCam imagery provides a complementary view of vegetation appearance and landscape change. The image archive contains more than 1,700 usable frames. Sensor and image records are aligned through their timestamps while preserving the causal order of observations.
Quality flags and missing records are retained during preprocessing. This is important because missingness is part of the deployment problem rather than only a data-cleaning issue. The model must distinguish between a measured normal value and a value that has not yet arrived.
The current-condition component is anchored to a precipitation-based drought indicator calculated only from information available at the prediction time. Learned outputs provide short-term meteorological and soil-related outlooks. The exact target construction and evaluation protocol are reserved for the associated scientific manuscripts.
System Overview
The prototype contains three main components:
- Environmental time-series analysis, which summarizes recent atmospheric and soil observations.
- Visual analysis, which represents vegetation and landscape information from the most recent usable PhenoCam image.
- Availability-aware multimodal inference, which combines the evidence that is actually present at a given time.
A pretrained visual representation model is used to encode the PhenoCam imagery. A vision-language model provides structured visual interpretation and a user-facing explanation layer. Missing or delayed modalities are represented explicitly so that an unavailable image is not treated as a real image containing zero-valued features.
The dashboard separates the observed current condition from learned future forecasts. It reports the current evidence, short-term risk estimates, input availability, and an overall reliability indicator. The language model is used to explain these outputs but does not independently redefine the numerical forecast.
Further architectural details, feature construction, training objectives, and fusion strategies are intentionally omitted from this public project description and will be reported in future peer-reviewed work.
Edge Demonstration
The demonstration provides three complementary views.
Live Forecast
The Live Forecast interface accepts currently available sensor measurements, a recent image, or either modality independently. This allows the system to demonstrate prediction under incomplete observations rather than requiring every input to arrive at once.
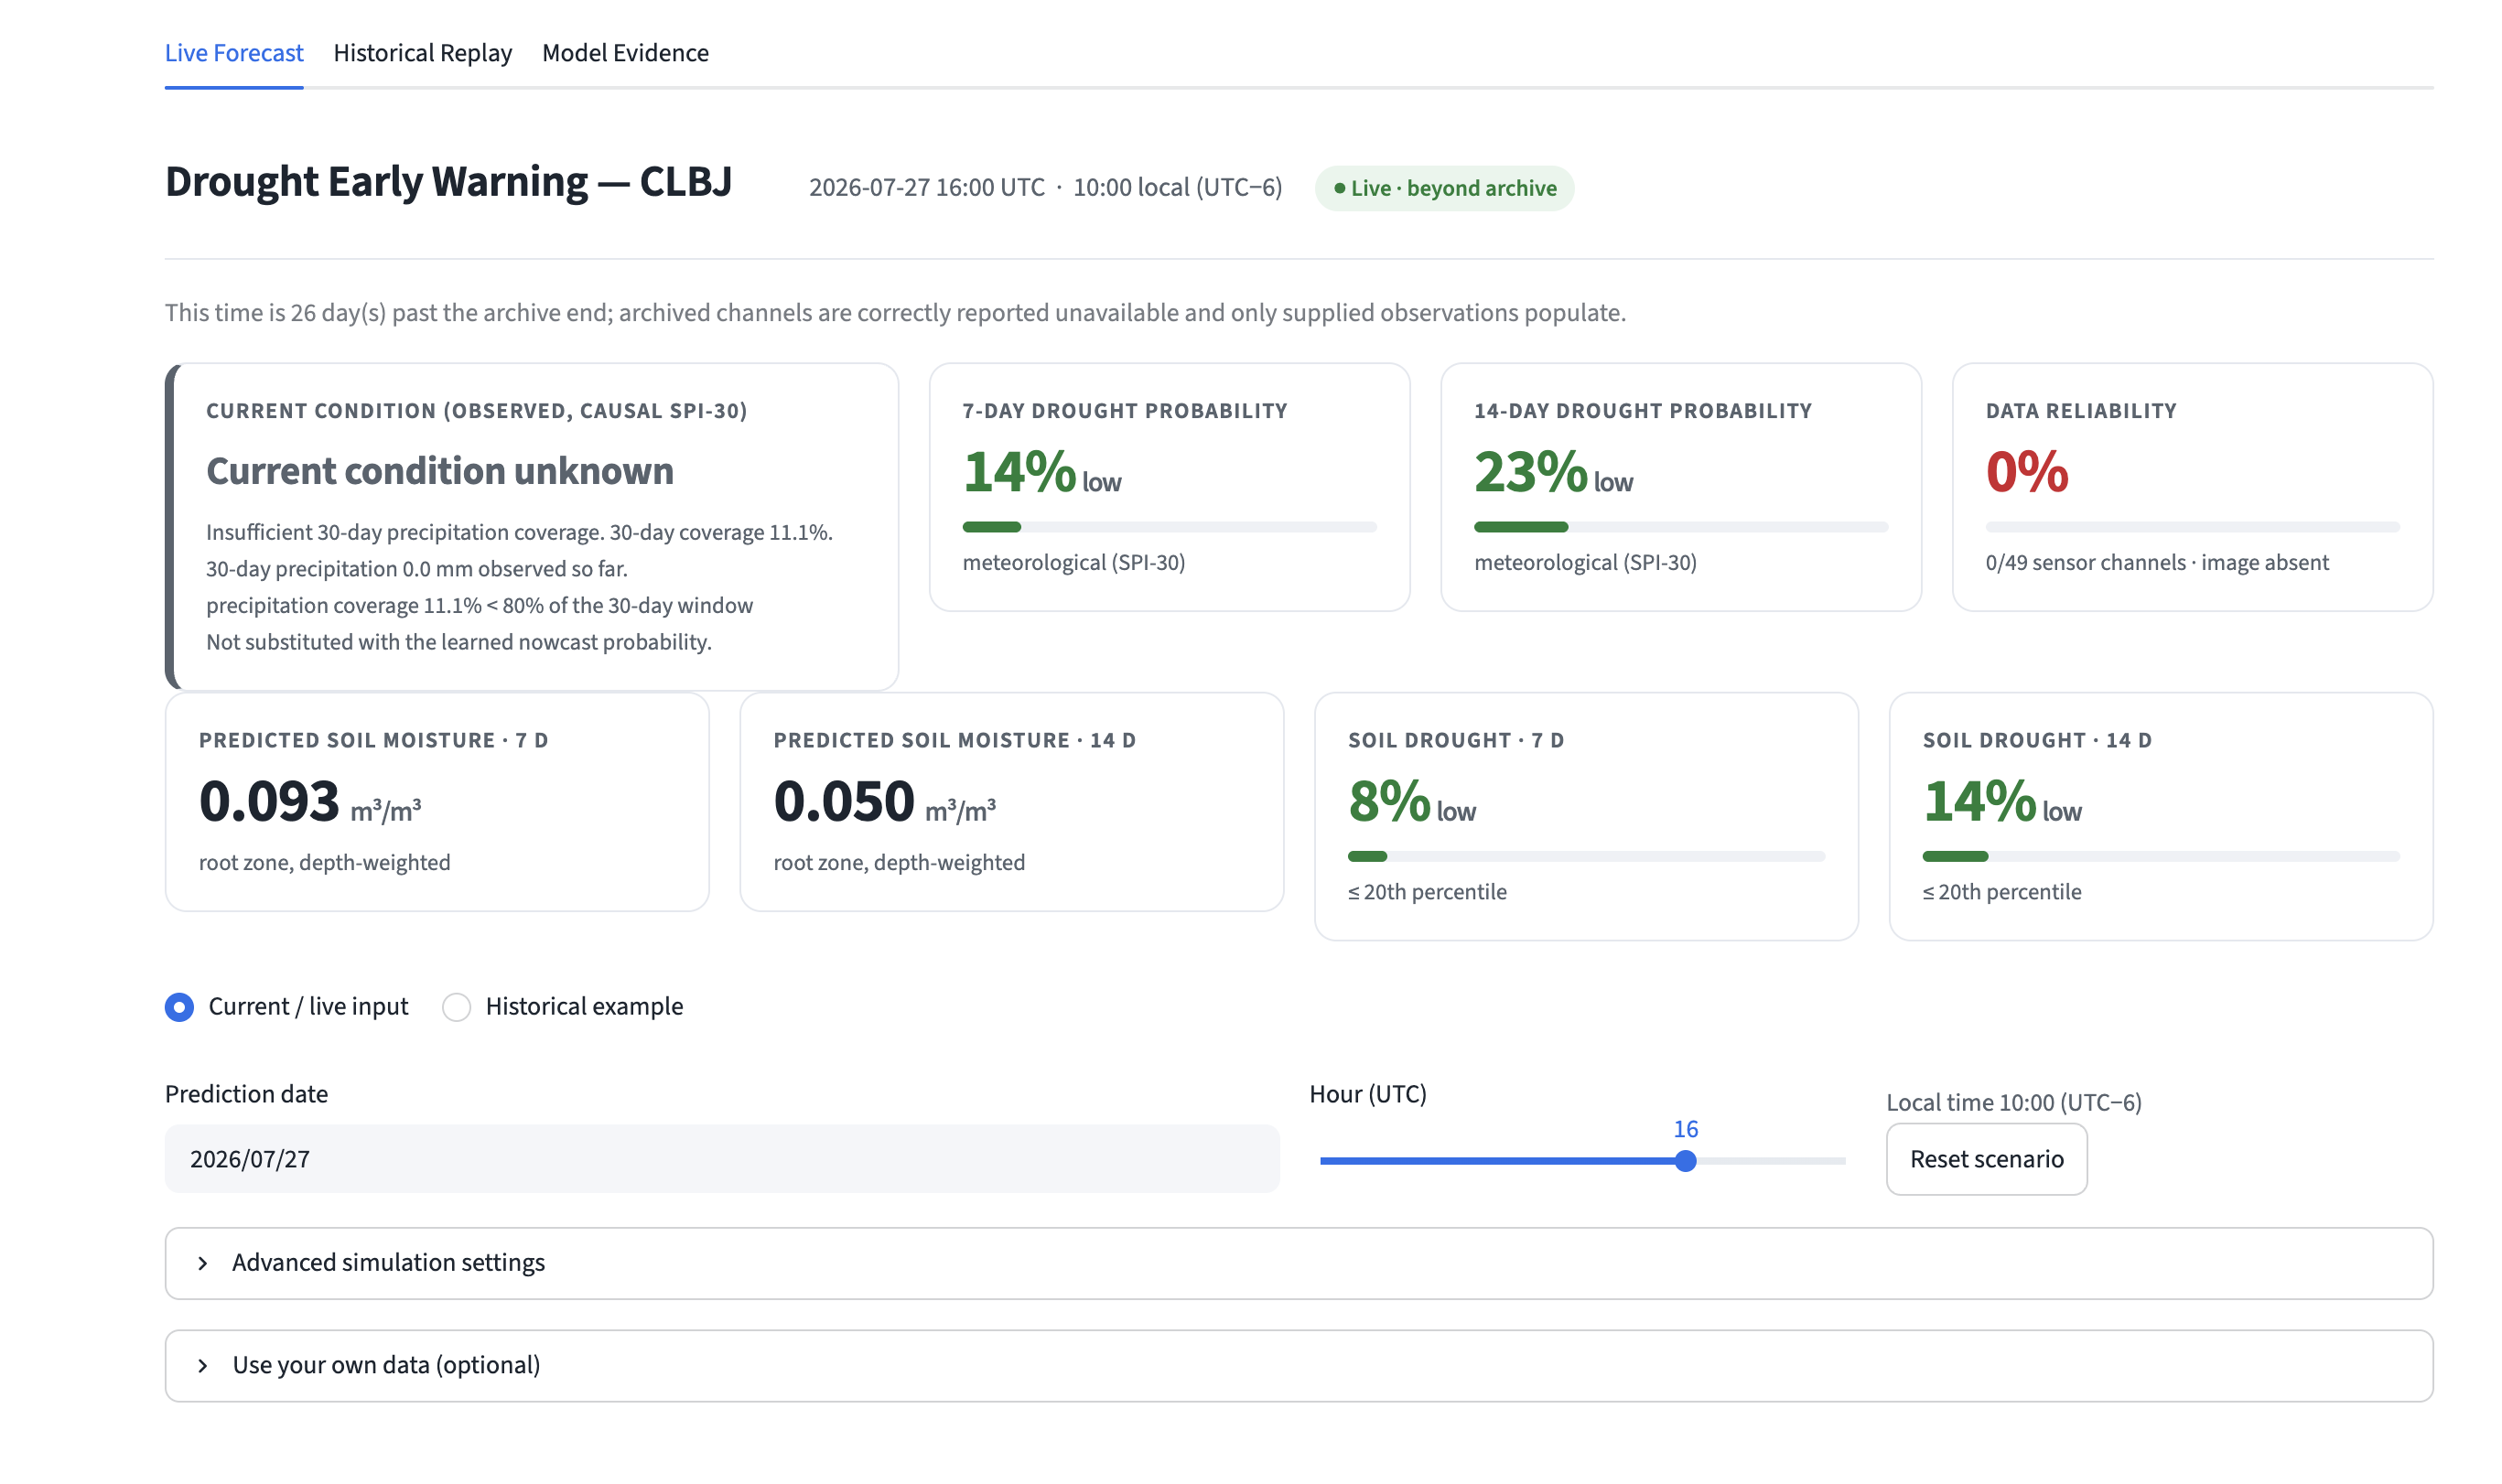
Figure 2 Live Forecast.
Historical Replay
Historical Replay reconstructs a selected point in the archive and shows how the output changes as additional observations become available. It is intended to represent asynchronous environmental data collection rather than claim that the archive contains original real-time ingestion timestamps.
Model Evidence
Model Evidence separates observation-based indicators from learned predictions and highlights cases in which the sources of evidence agree, disagree, or are insufficient. This distinction is important for avoiding an overly confident interpretation of a research prototype.
The numerical inference pipeline and dashboard currently run in a GPU-enabled container on an NVIDIA Thor development node. A locally hosted language model provides the explanatory interface. The scientific forecast remains available even when the language model is slow or unavailable.
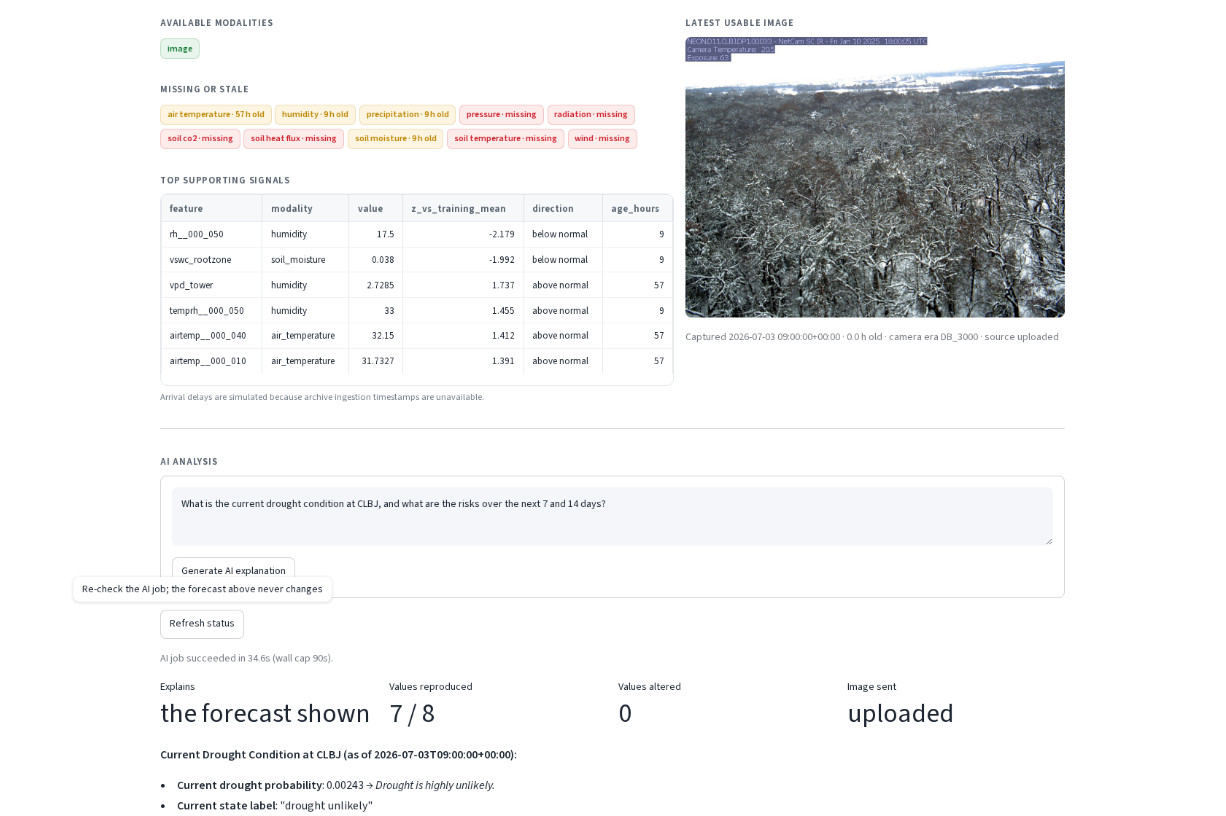
Figure 3 Edge demonstration.
Preliminary Findings
Initial experiments suggest that the prototype can reproduce meaningful drought episodes within the CLBJ historical record and can continue operating when selected inputs are unavailable. The results also show that the value of imagery depends on the prediction target and the state of the sensor network.
Environmental sensors remain particularly important for precipitation-defined meteorological drought. Imagery provides a different source of evidence related to visible vegetation response and may become more useful when sensor coverage is degraded or when the target concerns ecosystem or soil response.
These findings motivate an availability-aware multimodal design, but they should not be interpreted as evidence of geographic generalization. Detailed numerical results, event-based evaluation, baselines, calibration analysis, and ablation studies are reserved for future scientific publications.
Current Limitations
The current system is a single-site research prototype. Its evaluation demonstrates temporal performance at CLBJ but not transfer to other geographic regions.
The historical archive also does not reproduce every aspect of an operational data stream. Arrival delays used in the replay are simulated, and newly supplied observations are entered manually. The Thor deployment demonstrates computational portability, but the device is not physically deployed at the CLBJ site.
Sensor quality and coverage vary across measurements and time. The PhenoCam record also contains changes in imaging conditions that must be considered when interpreting visual trends. These issues are active research topics rather than fully solved components.
The dashboard should therefore be viewed as a demonstration of a possible edge workflow, not as an operational drought advisory or a replacement for official drought products.
Future Directions
The next engineering step is integration with the Sage/Waggle software ecosystem. A native edge application could subscribe to available sensor and camera measurements, maintain a rolling causal state, run inference after meaningful updates, and publish results through the Sage data infrastructure.
The next scientific step is multi-site evaluation. Planned additions include NEON sites in Colorado and Wyoming, followed by cross-site experiments that measure transfer across climate regions, vegetation types, sensor layouts, and camera views.
Future research will also examine uncertainty calibration, event-level evaluation, adaptive model selection, and resource-aware execution. Lightweight numerical inference could run whenever new measurements arrive, while more expensive visual or language analysis could be triggered only by meaningful changes or explicit user requests.
This direction connects local drought early warning with the broader Sage objective of responsive, distributed, and resource-aware artificial intelligence at the edge.
Code and Resources
- Sage Project Example: Application-Agnostic Dynamic Data Collection for AI on the Edge
- Sage Edge App Tutorials
- Sage Access Waggle Sensors Tutorial
- Waggle Sensor GitHub
- NEON CLBJ Field Site
- Project code repository: [Add repository URL]
- Interactive demo: [Add stable demo URL]
Acknowledgments
This project uses data provided by the National Ecological Observatory Network and edge-computing resources provided through the Sage/Waggle ecosystem. Add team member names, mentors, institutional support, and funding acknowledgments before publication.